Live · Open data
Kolkata City Dashboard
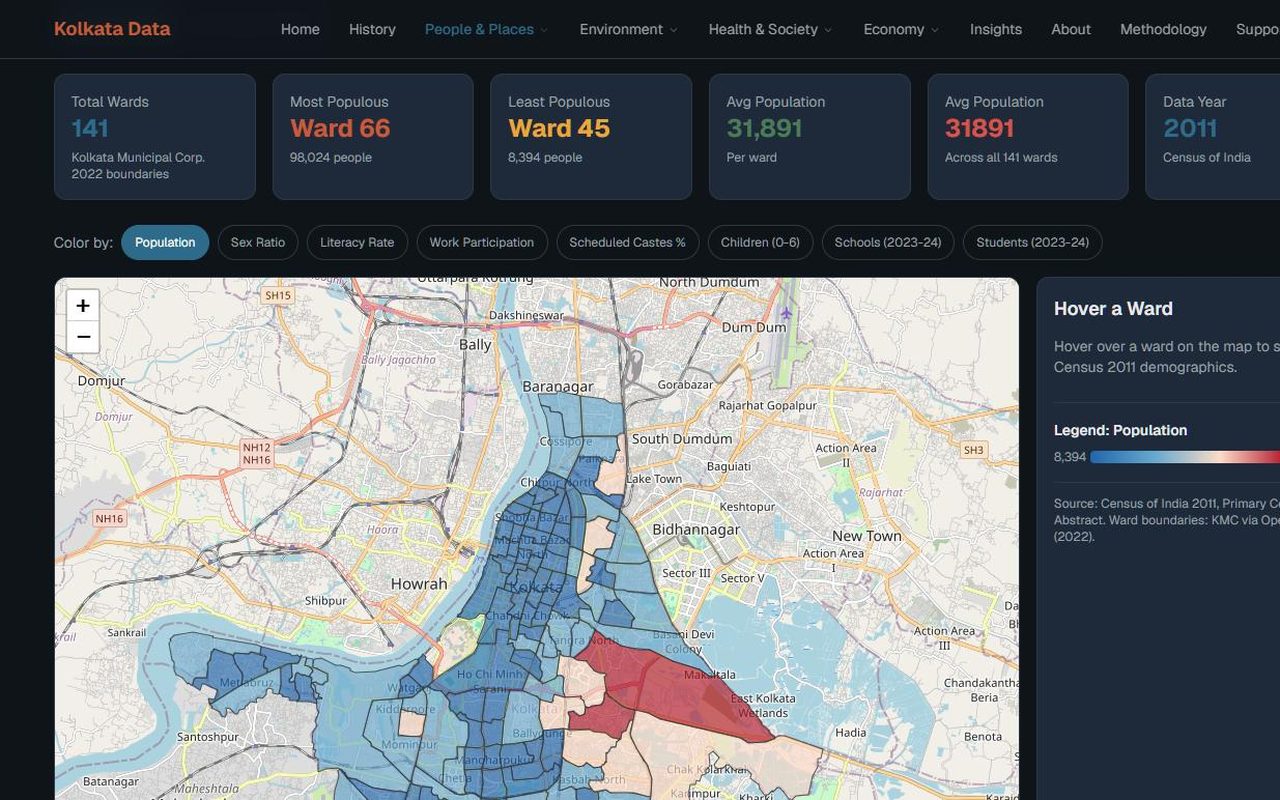
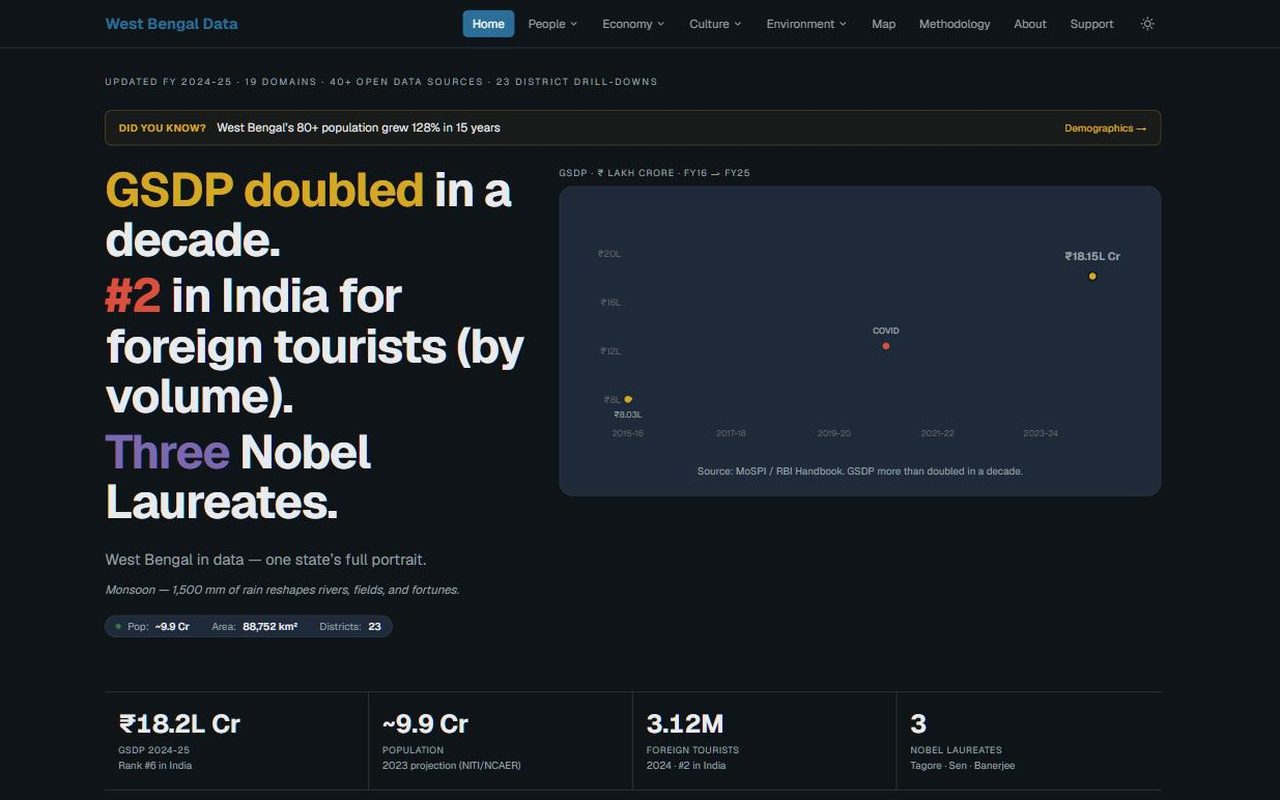
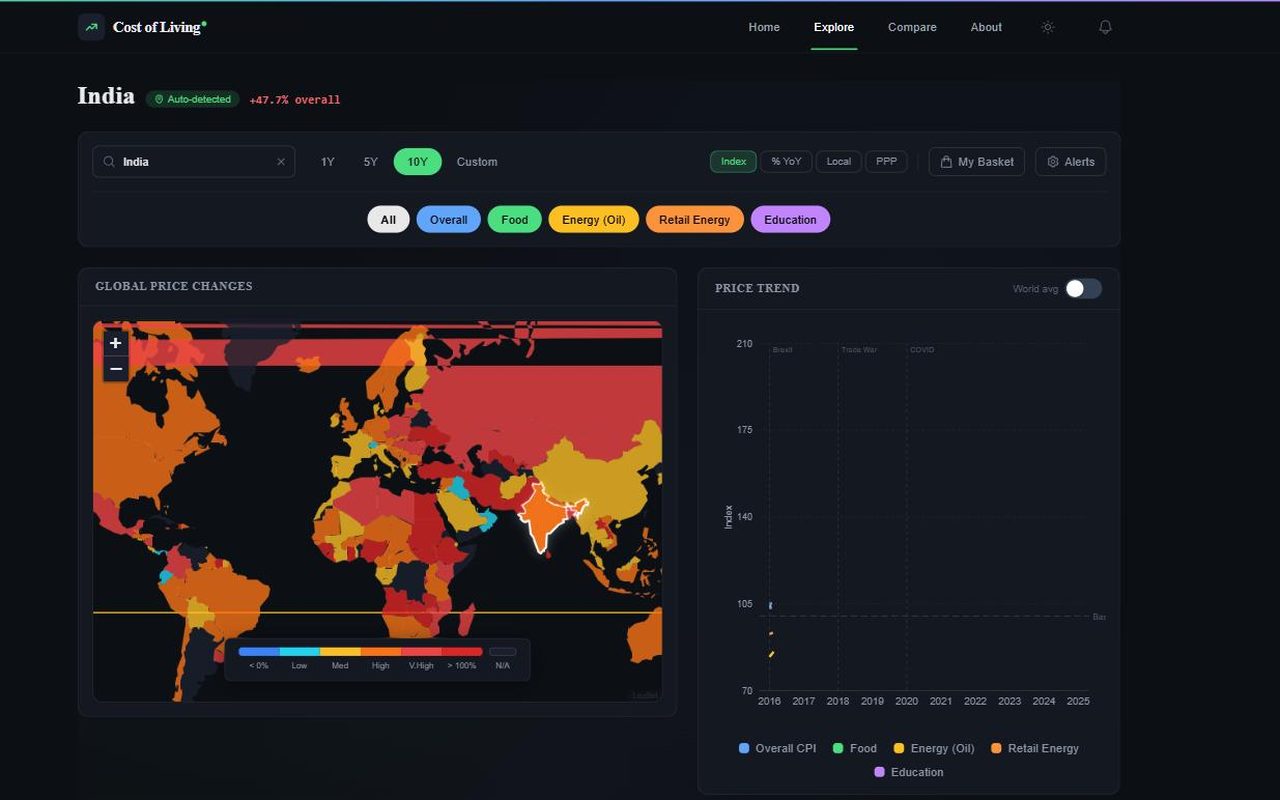
Nineteen domains of open data about one city — demographics, climate, air quality, transport, budget, crime, health — stitched into a single interactive portrait.
Thirty-plus primary sources arrive as APIs, CSVs and PDF-only government releases. A Python pipeline cleans and aggregates them into JSON committed to the repo; Next.js inlines that at build time, so every chart is pre-rendered with no runtime database. Every figure links back to its source, and the known limitations are published rather than hidden.
-
141Wards mapped
-
30+Primary sources
-
19Domains